Using the panel
Live bandwidth monitor
Pick a router and an interface, and watch the traffic as it happens.
1 min read · Updated
Included in Standard and Pro.
Steps
- Open Live bandwidth in the menu, or on a router's page.
- Choose the Router at the top right, if you have several.
- Choose the Interface, for example your internet port (often
ether1). Running interfaces are listed first. - Choose how often to Refresh: every 1, 2 or 5 seconds.
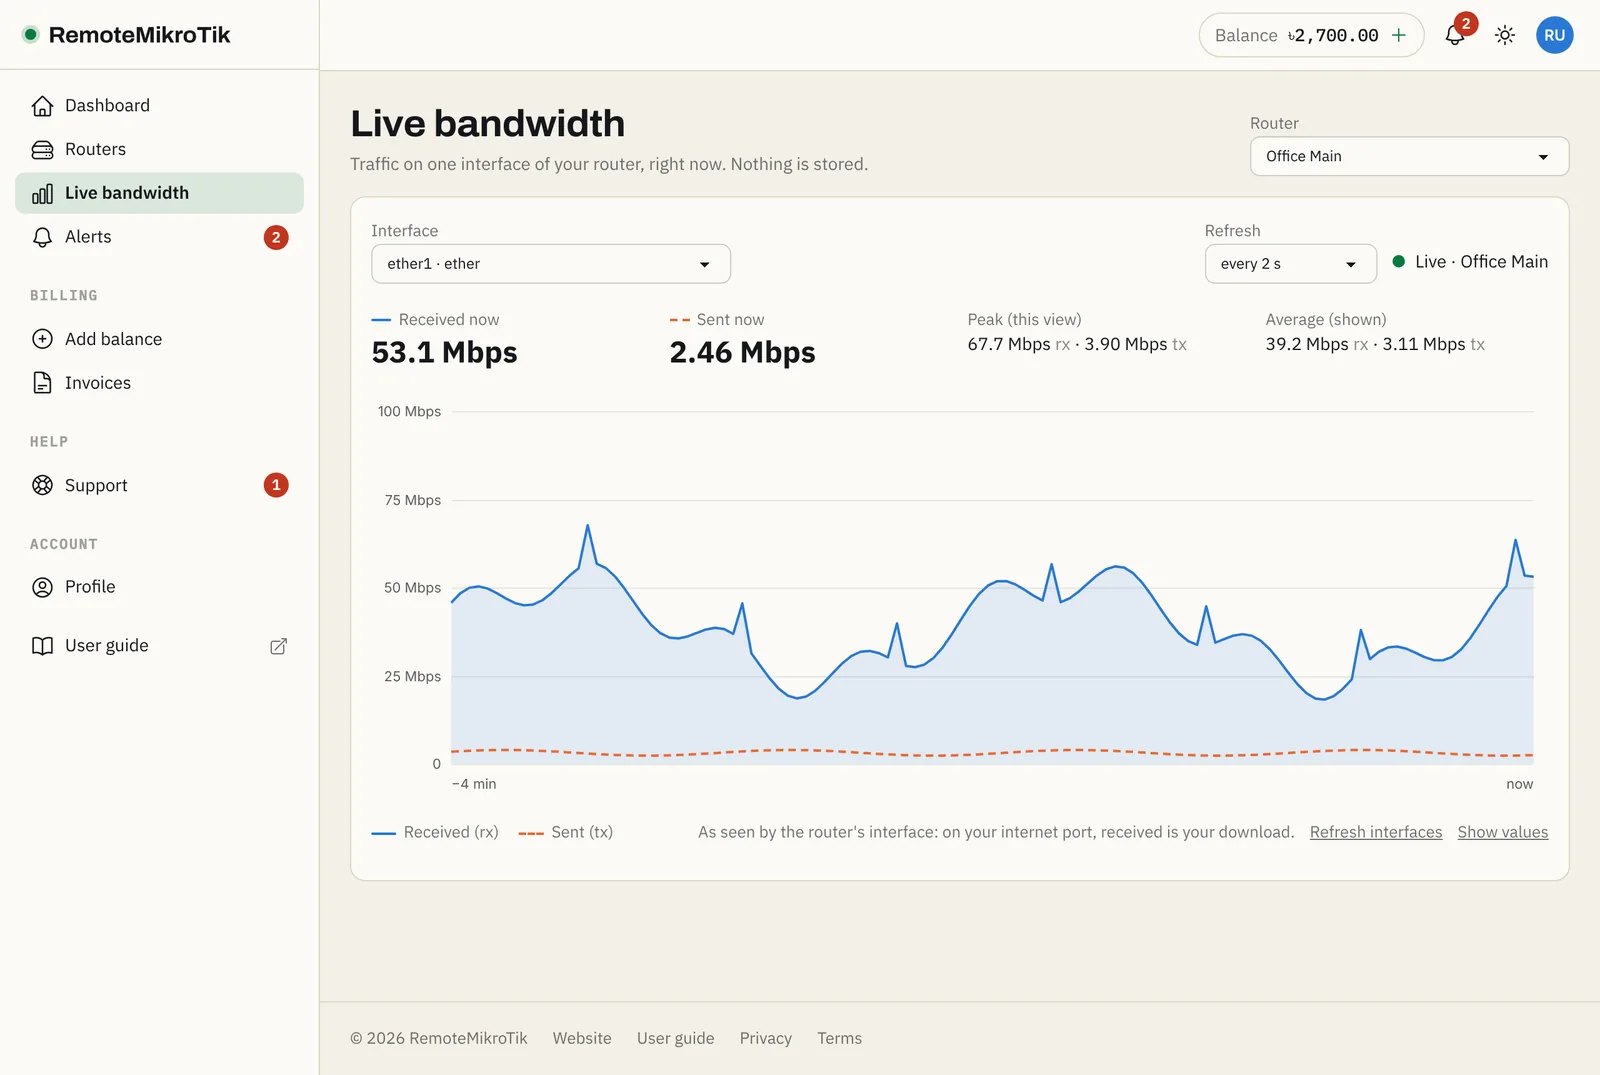
- Watch the graph. Hover over it to see the exact values at a moment.
Reading the graph
- Blue line, received (rx): traffic coming into the interface.
- Orange dashed line, sent (tx): traffic going out of the interface.
- Peak and Average: over what is currently shown.
- The scale adjusts itself: Kbps, Mbps or Gbps.
The graph pauses when you switch to another tab and after 10 minutes, so it never loads the router when nobody watches. Press Resume to continue.
If something goes wrong
- "The router is offline": there is nothing to measure until it reconnects.
- An interface is missing: press Refresh interfaces; new VLANs or bridges appear after a refresh.
- "Could not read from the router": the panel's router user may have been removed. Run the setup script again.
Questions
Is the traffic history saved?
No. The graph only shows what happens while the page is open. Nothing is stored.
Does it slow down my router?
No. It reads one small counter every few seconds, pauses when you switch tabs, and stops after 10 minutes without activity.
Why is received not my download?
Received and sent are as seen by the router's interface. On the internet (WAN) port, received is your download. On a LAN port it is the opposite: received is what devices upload.
Still stuck? Open a support ticket and tell us which step didn't work.